Graph
Graph draws your archive as a network of projects, conversations, and the recorded links between them, such as shared files, commits, continuations, and agent messages. Use it to find related work across harnesses and projects. Graph is available only in the app; there is no CLI command.
- App
- Graph
Explore the graph in the app
Section titled “Explore the graph in the app”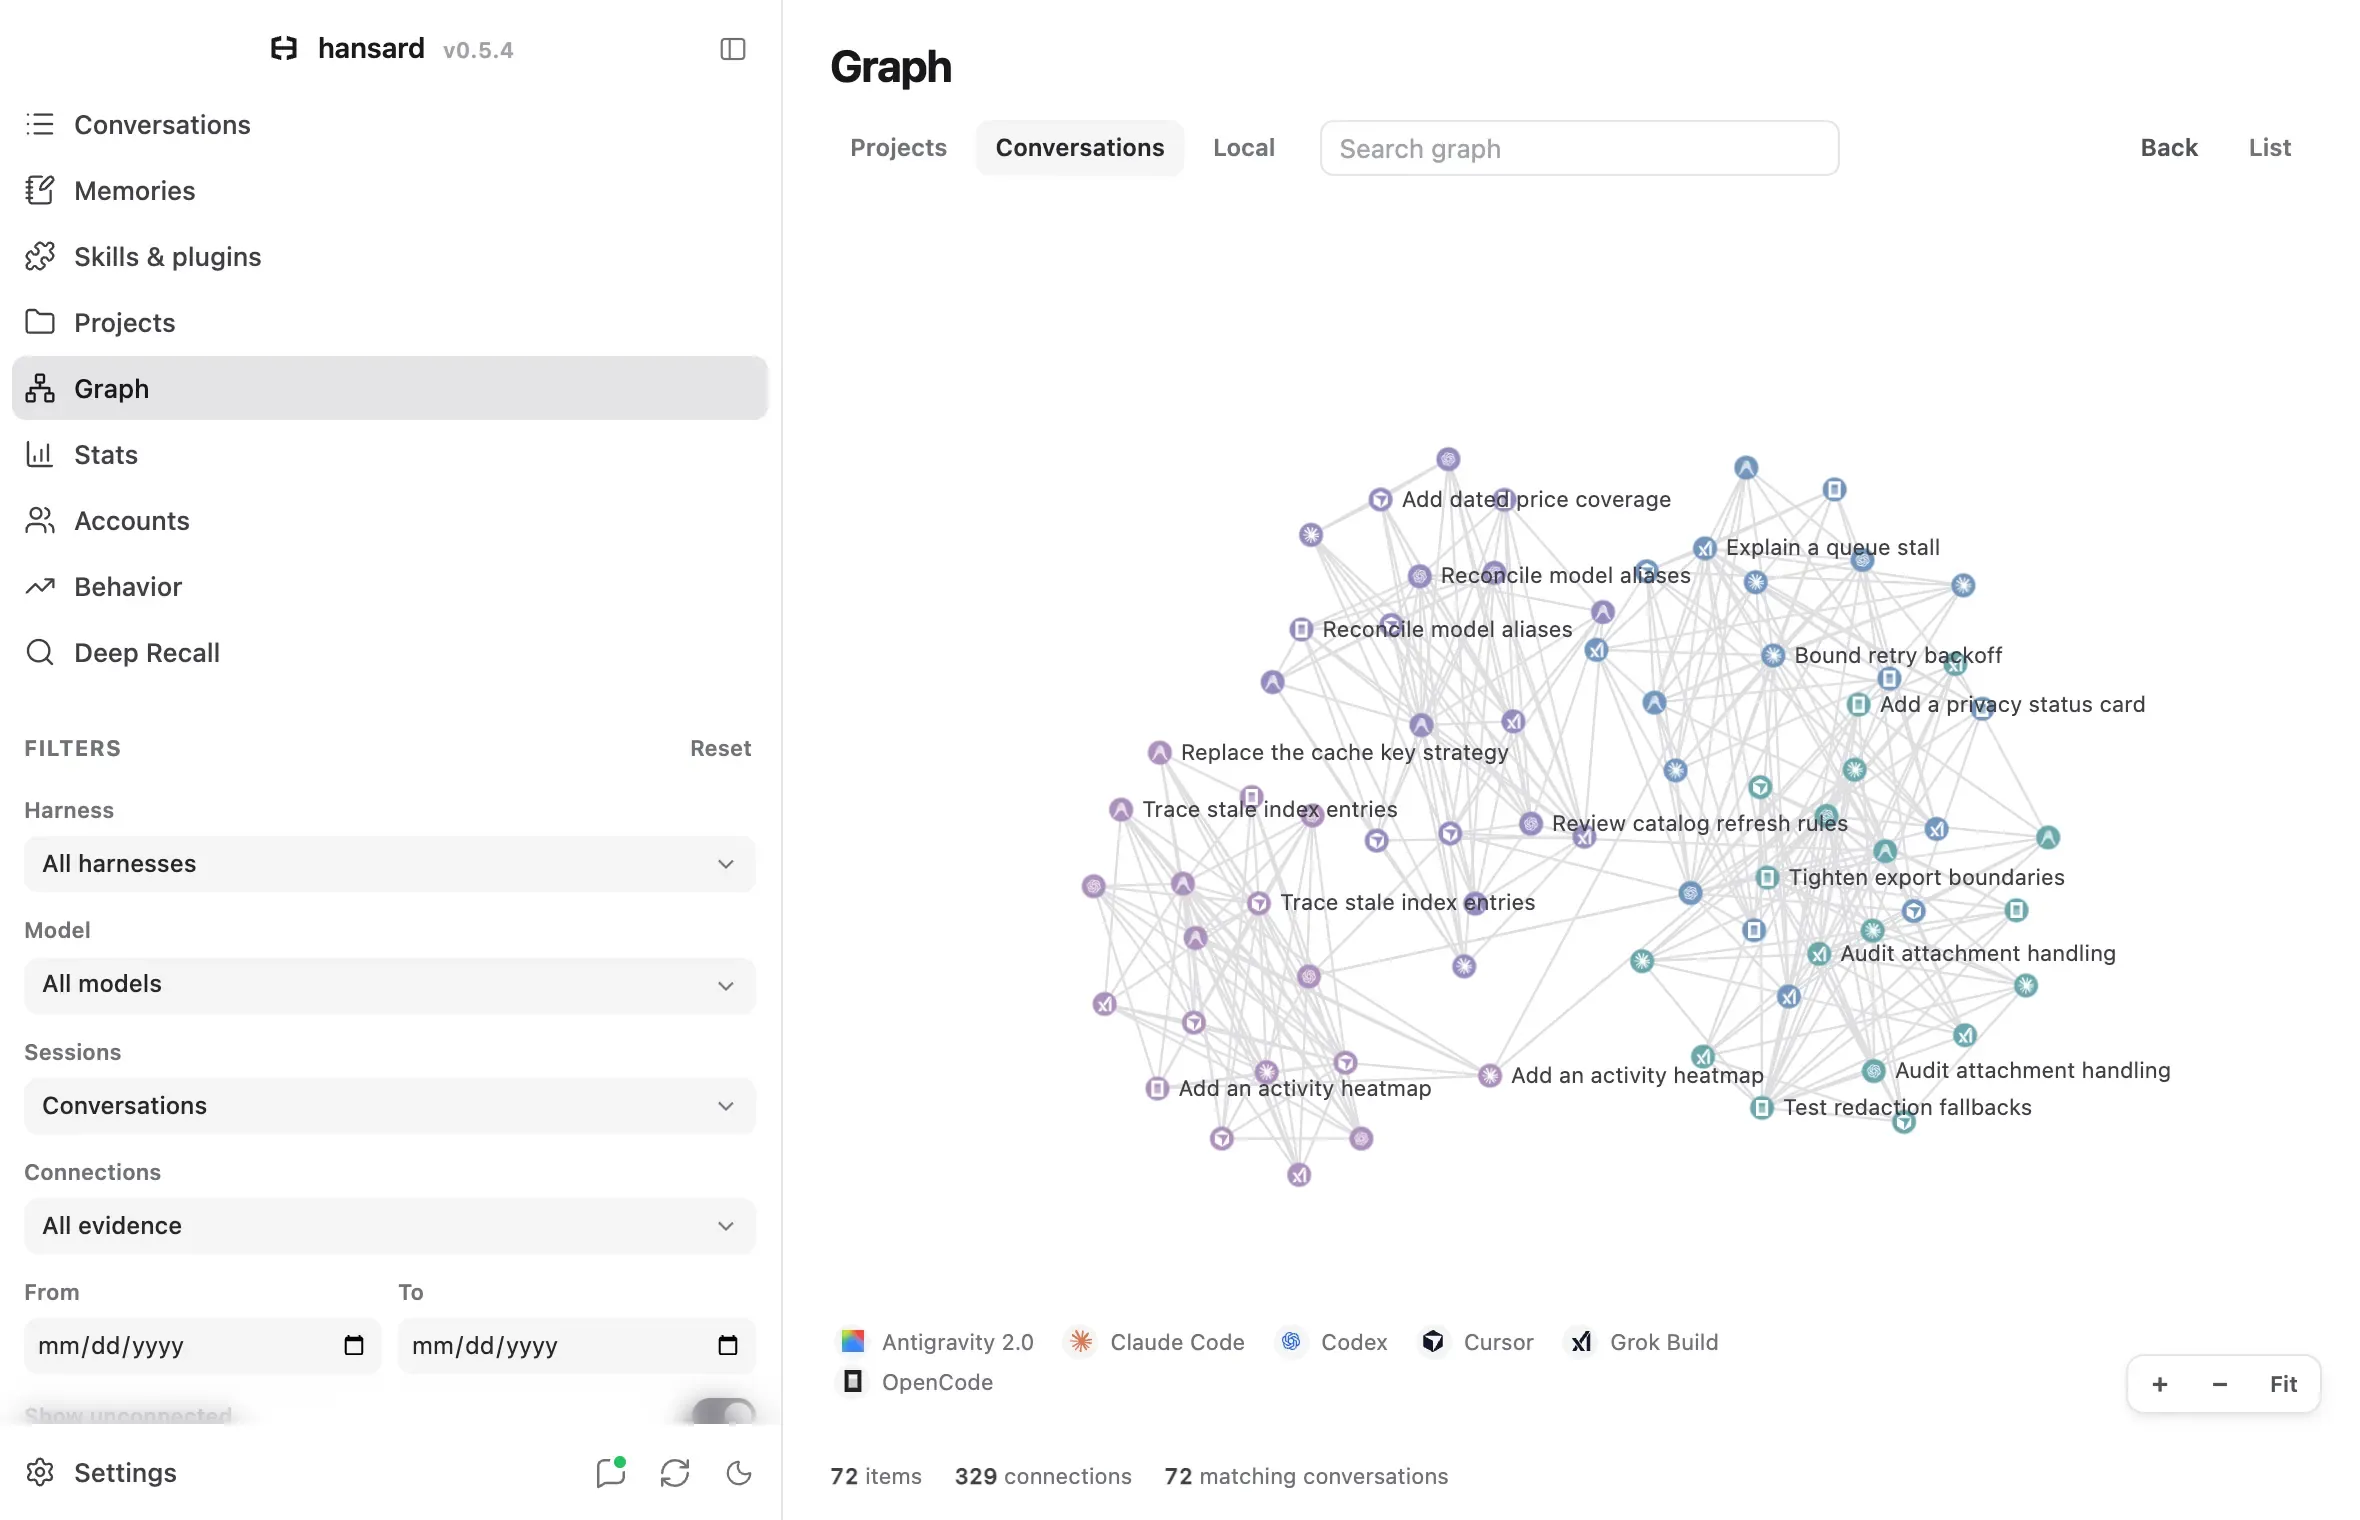
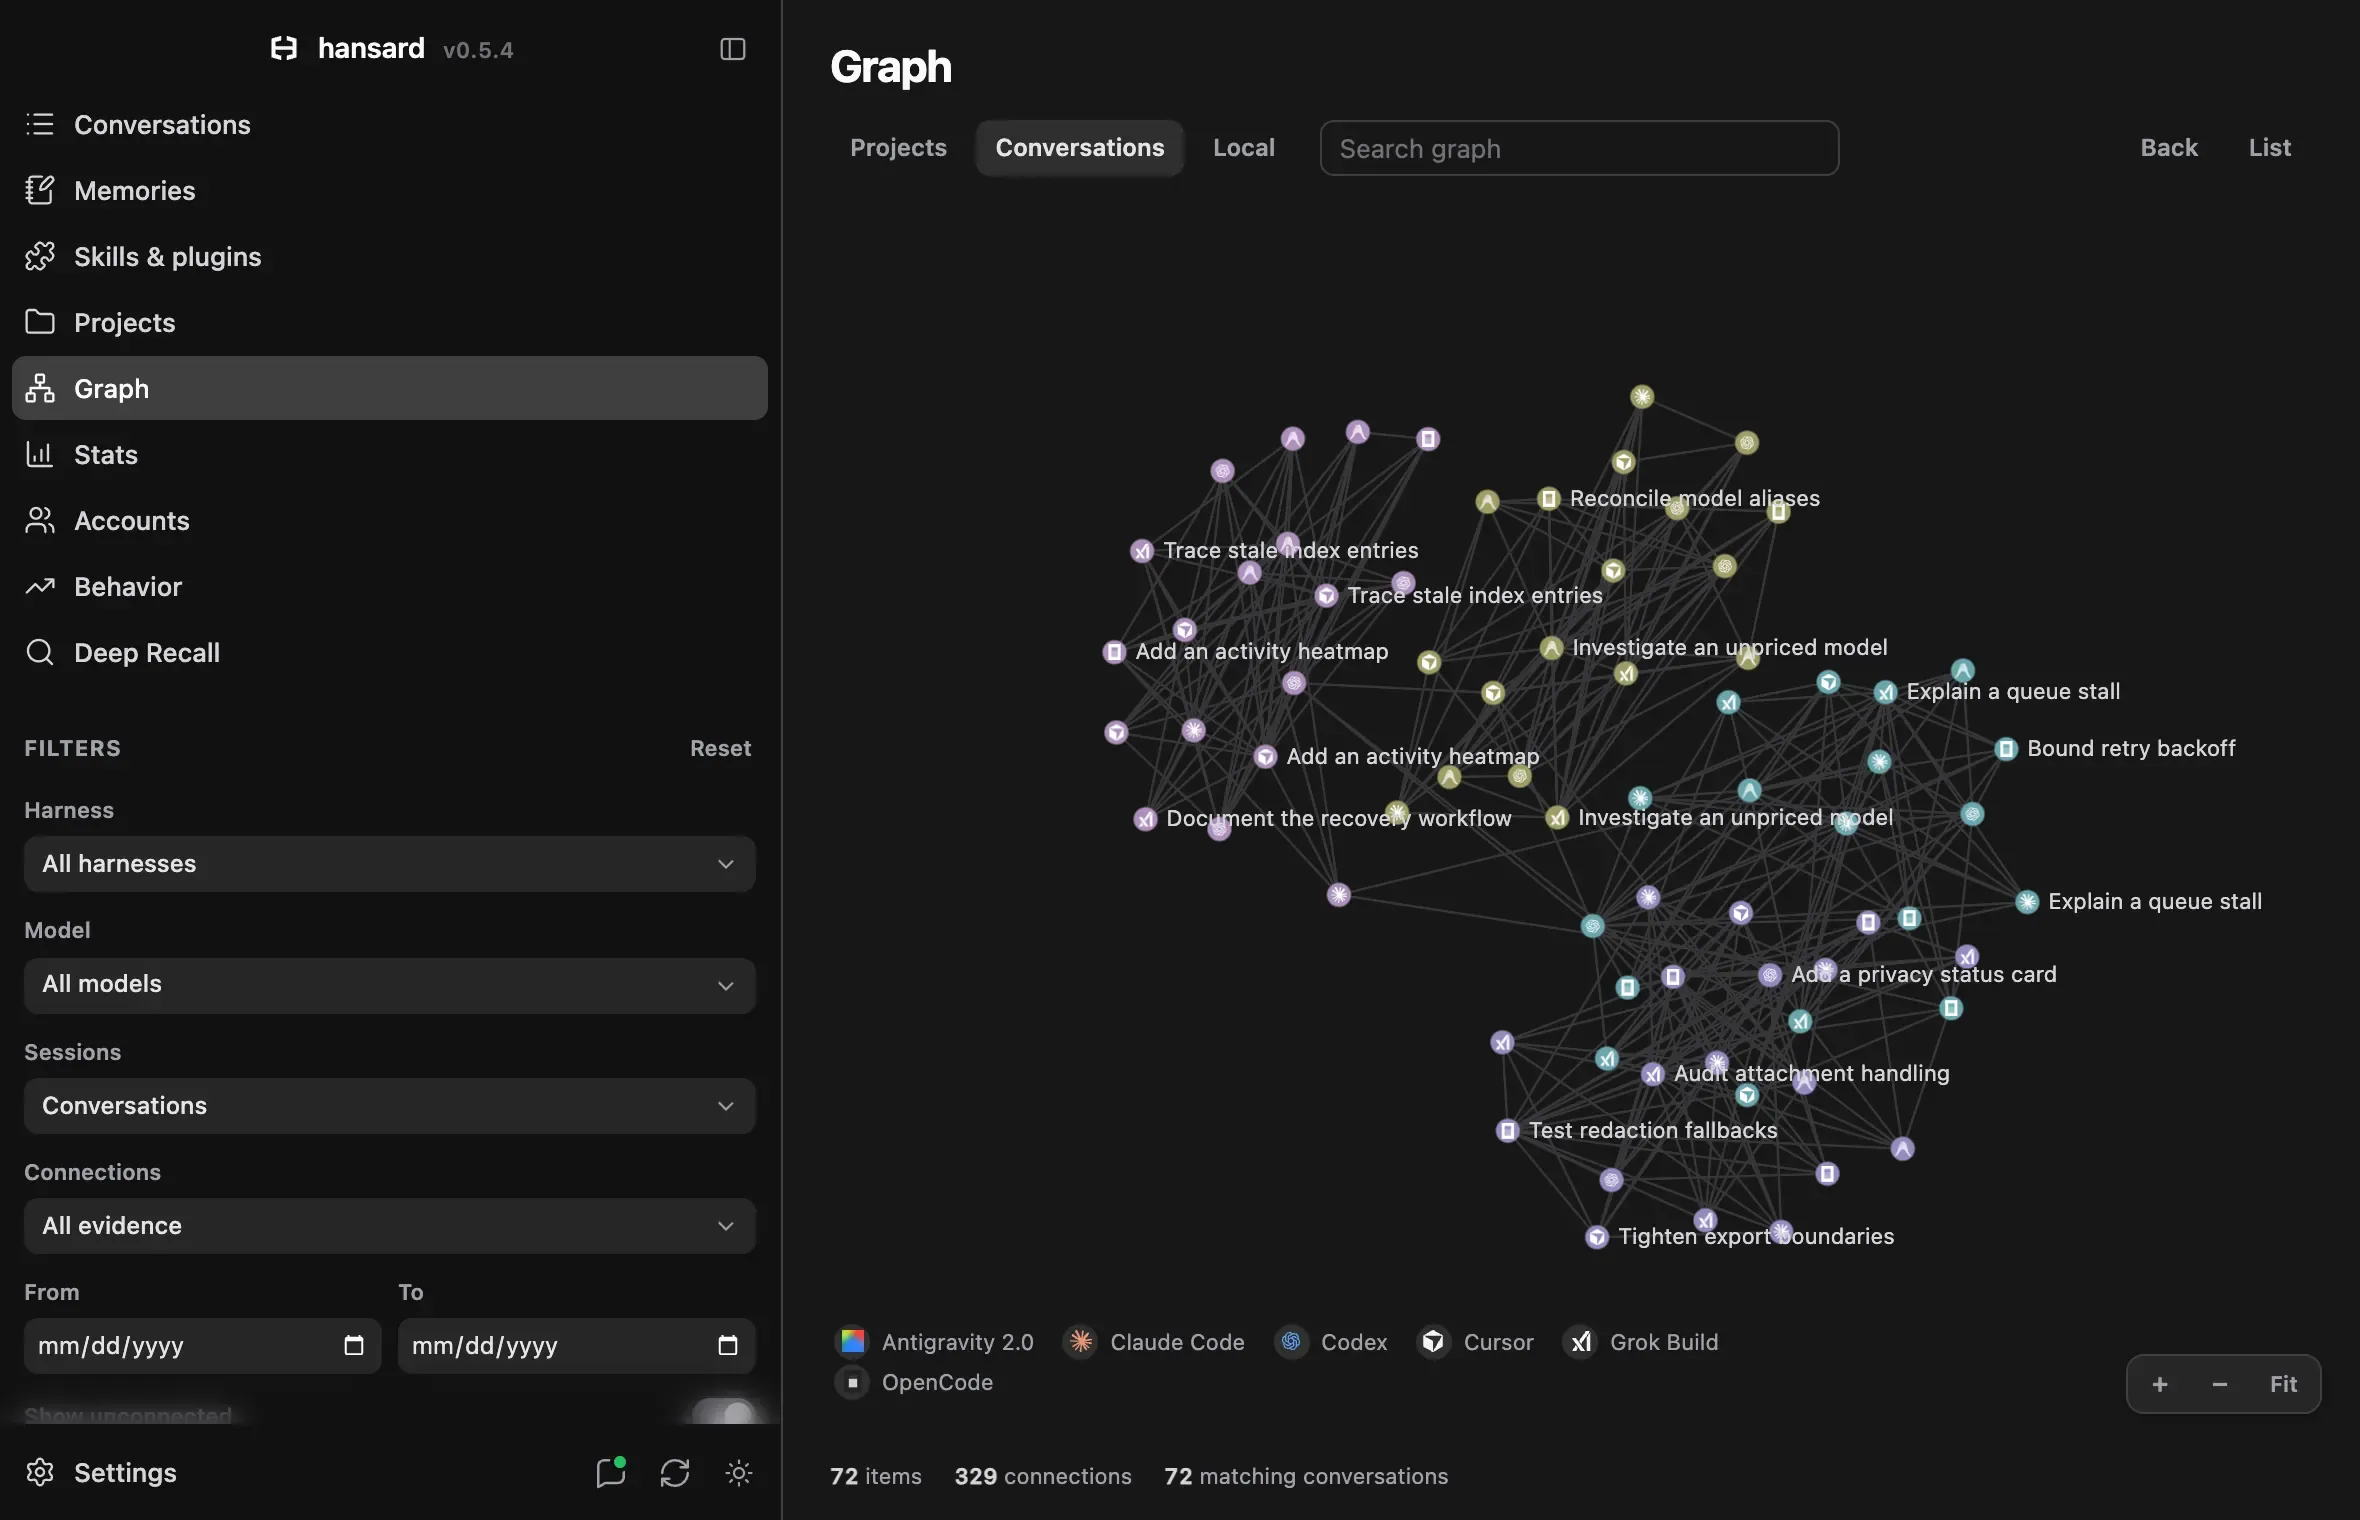
- Select Graph in the dock.
- Choose a level in the toolbar: Projects, Conversations, or Local.
- Select a node to open its details panel.
- In a project’s panel, select Explore to show that project’s conversations. In a conversation’s panel, select Focus to show its neighborhood in Local.
- To read a conversation, select Open conversation. For a memory node, select Open memory.
- To see why two nodes are linked, select a connection in the panel’s list or on the canvas.
- Select Back to return to the previous view.
To search, type in Search graph. Search reaches every indexed conversation, not only the ones on screen. Conversations shows the 400 most recent matches; use From and To to reach older ones.
When you explore a project, its name appears beside the Graph title. Select the name to clear the project scope.
Graph levels
Section titled “Graph levels”| Level | What it shows |
|---|---|
| Projects | One node per project. Each node is a pie of its conversations by harness or model, depending on Group by. A conversation that used several models is split equally among them. The slices show conversation shares, not token usage. |
| Conversations | Conversations in the current scope and the links between them. |
| Local | One conversation and its neighbors, one or two hops away. Local opens the conversation you selected, or a recent conversation in the current scope. |
In Local, turn on Show sources to add diamond nodes for the files, URLs, commits, and memories that conversations share.
Read connections
Section titled “Read connections”Select a connection to see what links two nodes and the evidence for it, with links to the supporting conversations. Connection types are:
| Connection | Meaning |
|---|---|
| Agent messages | The conversations exchanged messages through agent messaging. |
| Delegation | One conversation started the other as a helper or subagent. |
| Continuations | One conversation continues the other. |
| References | One conversation refers to the other, for example by its session ID. |
| Project mentions | A conversation refers to another project, for example by its repository URL. |
| Shared files, Shared URLs, Shared commits, Shared branches, Shared attachments | Both conversations recorded the same file, URL, commit, branch, or attachment. A file counts when a conversation edited it or named it; a URL counts when a conversation named it or its agent fetched the page. |
| Files read | Both agents opened the same file, or one opened a file the other edited. It links conversations more weakly than a shared edit. |
| Memory origins | A memory was recorded from the conversation. |
| Related topics | The conversations use similar language. |
Related topics is an inference from shared wording. It marks likely related work, not an explicit reference between conversations. Every other connection comes from something recorded in the archive.
Filter and adjust the graph
Section titled “Filter and adjust the graph”The sidebar holds the graph controls:
| Section | Controls |
|---|---|
| Filters | Harness, Model, Sessions, Connections, From, To, and Show unconnected. Reset beside the heading clears them. |
| Neighborhood | Depth (1 hop or 2 hops) and Show sources, for the Local level. |
| Display | Size (Uniform, Tokens, User messages, Connections, or Conversations). Reset restores Uniform. |
| Layout | Arrange (Connected clusters, Groups, or Forces only), Center force, Repulsion, Link force, and Link distance. Reset restores the default arrangement and forces, releases pinned nodes in the view, and places the graph again. |
| Groups | Group by (Project / portfolio, Connected clusters, Harness, or Model) and the legend of the groups it makes. Select a group to hide or show it, select Only to show that group alone, or select its swatch to change its color. Find a group searches the list, and Reset restores the default grouping, colors, and every hidden group. |
Harness, Model, and Connections accept several choices. Choices within one filter widen the result, and different filters narrow it together. Sessions chooses which kinds of sessions appear: Conversations (the default, which shows conversations people started), All agent work, Delegated, Subagents, or SDK jobs. Use Connections to show only some connection types.
Harness and model choices, and harness and model groups, follow the same order as every other filter in the app: by company, most capable model or newest harness first. To list them by how many sessions used them or by which you used most recently, use Settings → Appearance → Model order and Harness order.
Connected clusters gathers conversations that share evidence into separate islands. Links between islands stay drawn but barely pull, links inferred from shared language pull less than recorded evidence, and conversations without connections ring the islands when they are shown. Groups gathers each group from Group by into its own island instead, and Forces only places nodes by the forces alone. Nodes never overlap, so a larger Size moves neighbors aside, and the view fits the graph again after a display or layout change. While Graph is open, newly indexed conversations settle into place without moving the nodes already on screen.
Labels appear wherever they have room without covering another node or label; zoom in to see more. Hovering or selecting a node names every node it connects to. To keep a node in place, drag it or select Pin; select Unpin to release it.
Navigate with the keyboard
Section titled “Navigate with the keyboard”When the canvas has focus, the arrow keys pan, + and - zoom, F fits the
graph to the window, and Escape clears the selection. The buttons at the
right of the status bar zoom with + and − and fit the graph with
Fit. Reset beside them returns filters, groups, display, layout, and
pinned nodes to their defaults and keeps the current level. Pause stops the
layout from moving.
Select List to browse the current nodes as a keyboard-friendly list. The list also works when the device cannot draw the graph.
Troubleshooting
Section titled “Troubleshooting”The graph is empty and says it is building. Hansard builds the graph from your archive on this machine, in the background, the first time you open Graph and after upgrades. Nodes appear as indexing progresses; the status bar shows “Indexing in the background” until it finishes. Nothing leaves your machine.
The status bar says indexing is paused, or the graph did not load. Select Retry in the status bar.
A project or conversation is missing. Check Filters, especially Sessions, From, and To, or select Reset beside Filters. Conversations shows the 400 most recent matches, so search or narrow From and To to reach older ones.
Local cannot find a conversation. No conversation in the current scope matches the filters, or none has been indexed yet. Adjust the filters, then select Local again.