Compare periods
The Changes tab on the Stats page compares the selected time range with the period of the same length right before it: how much you did, where the work went, how your sessions ran, when you worked, what was new, and, when classification is on, what kind of work you did and how it turned out. Use the other Stats tabs for totals within one range, and Changes to see what moved.
- App
- Stats → Changes
- CLI
hansard behavior
Compare periods in the app
Section titled “Compare periods in the app”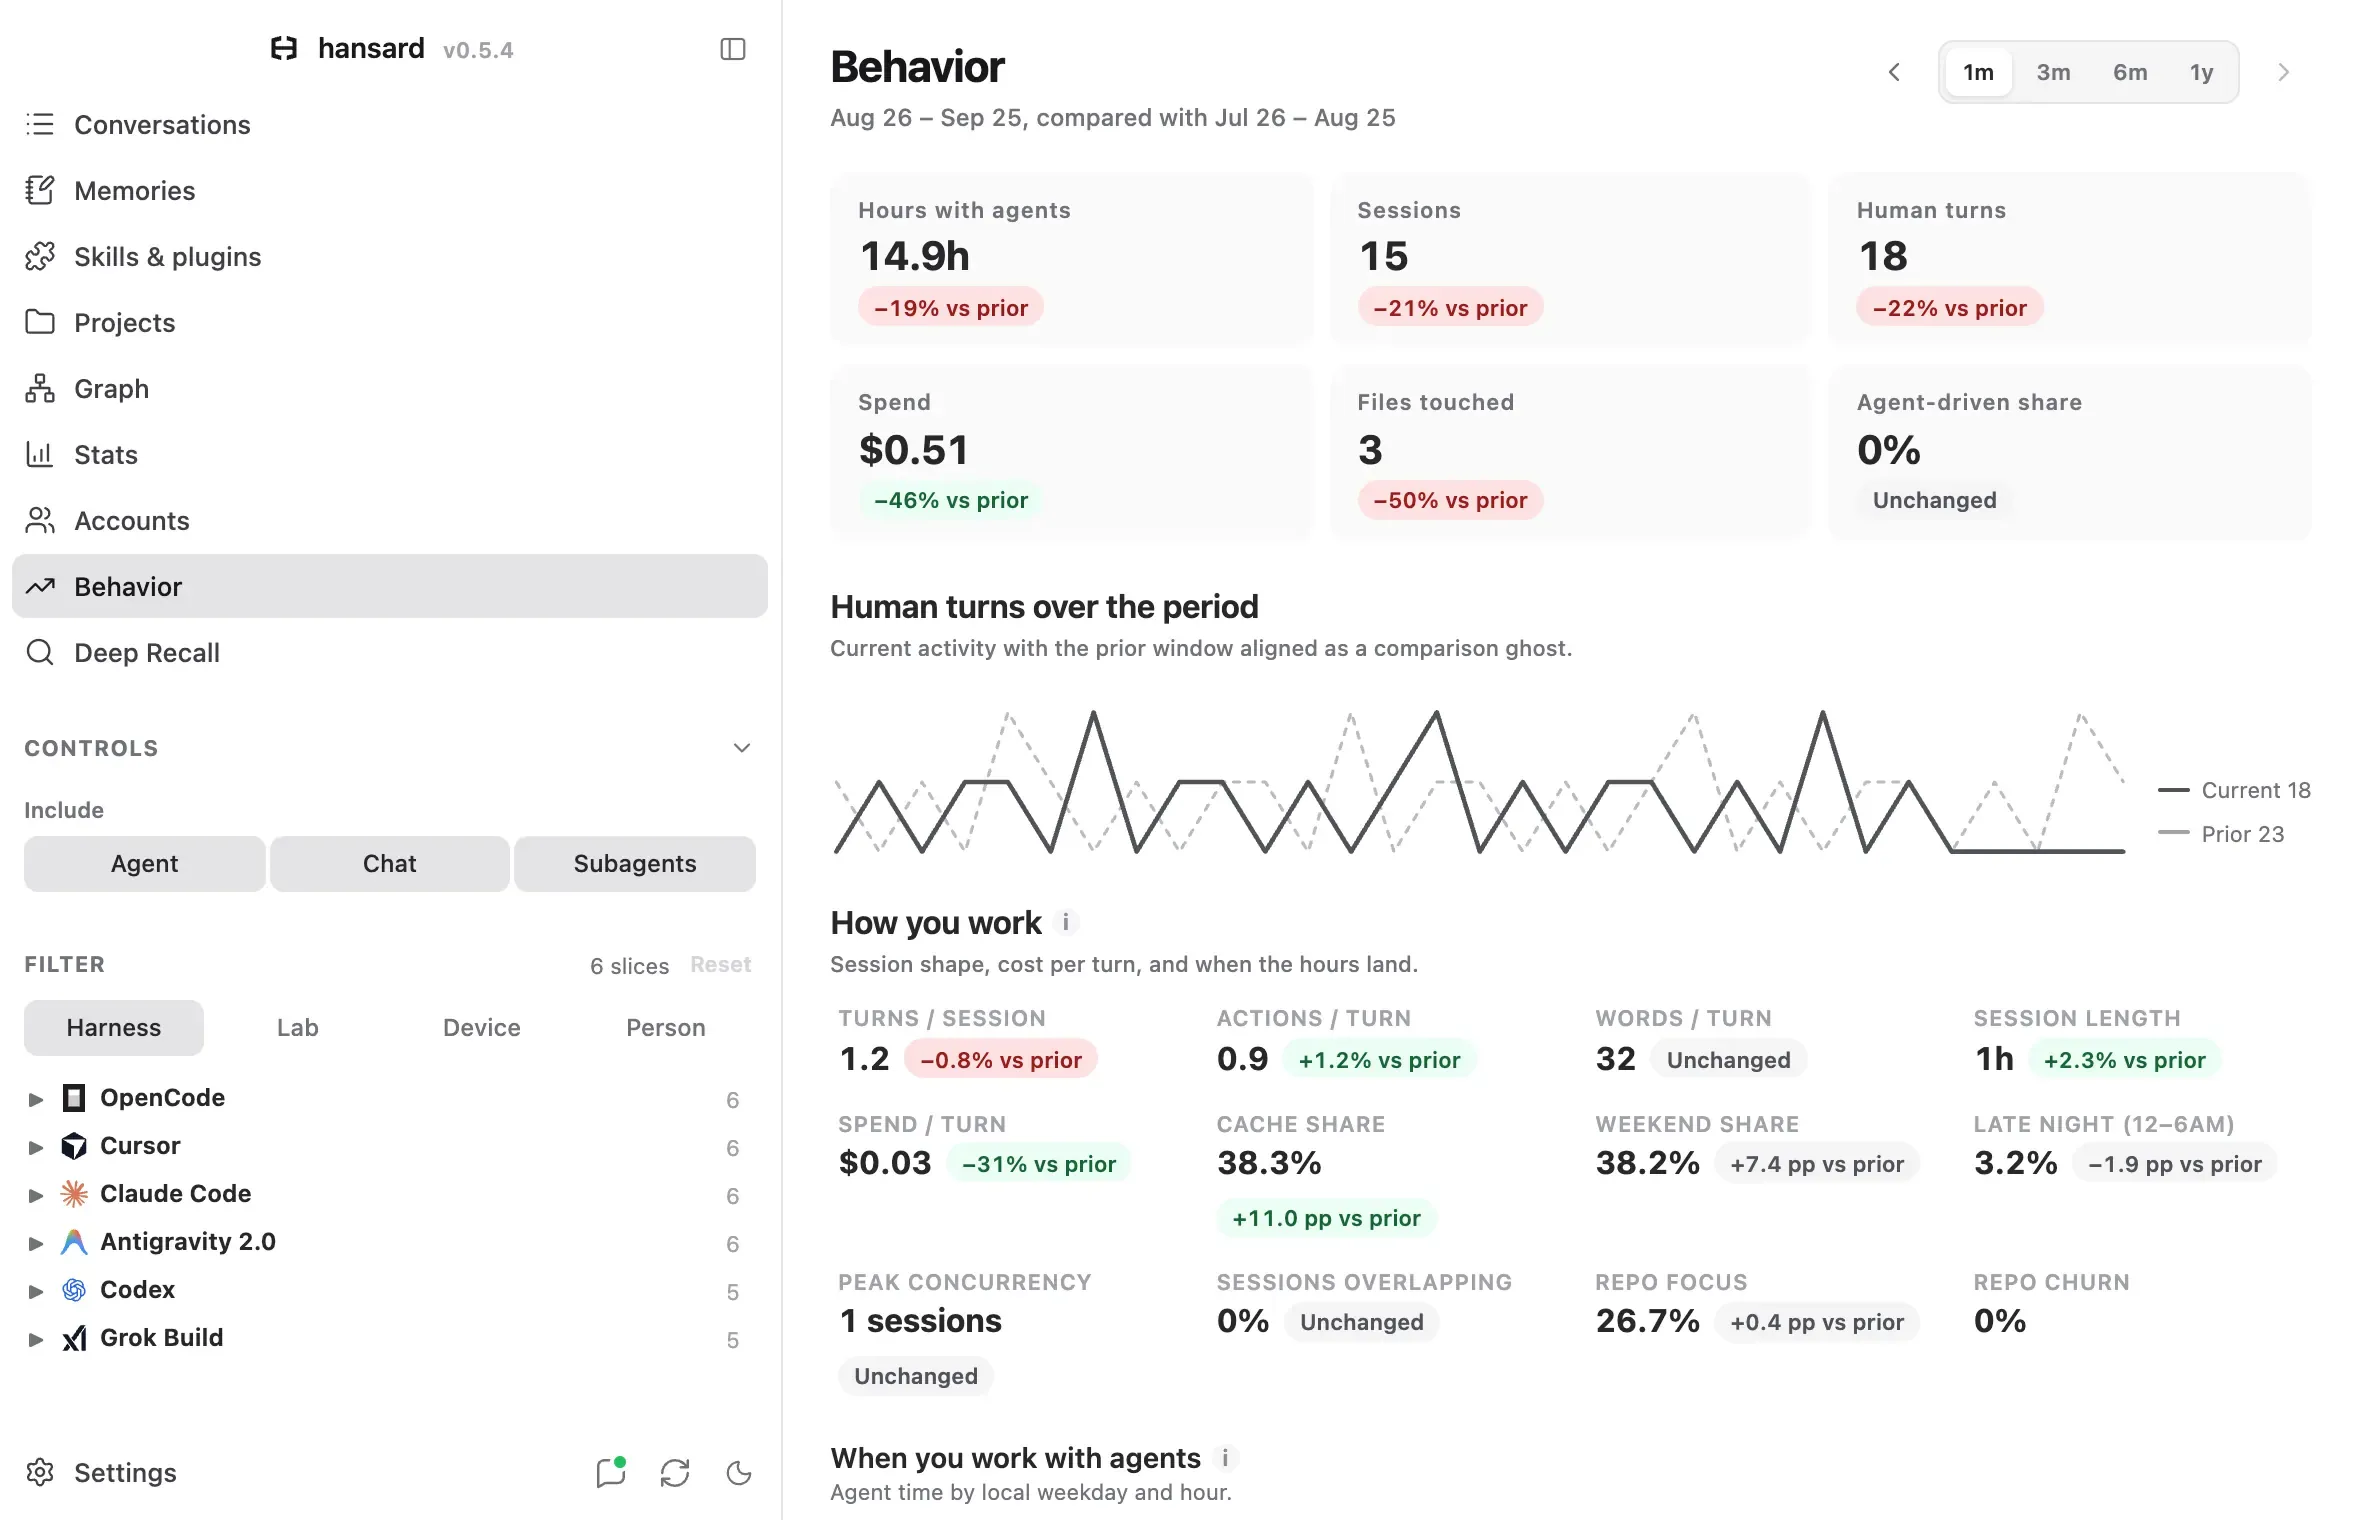
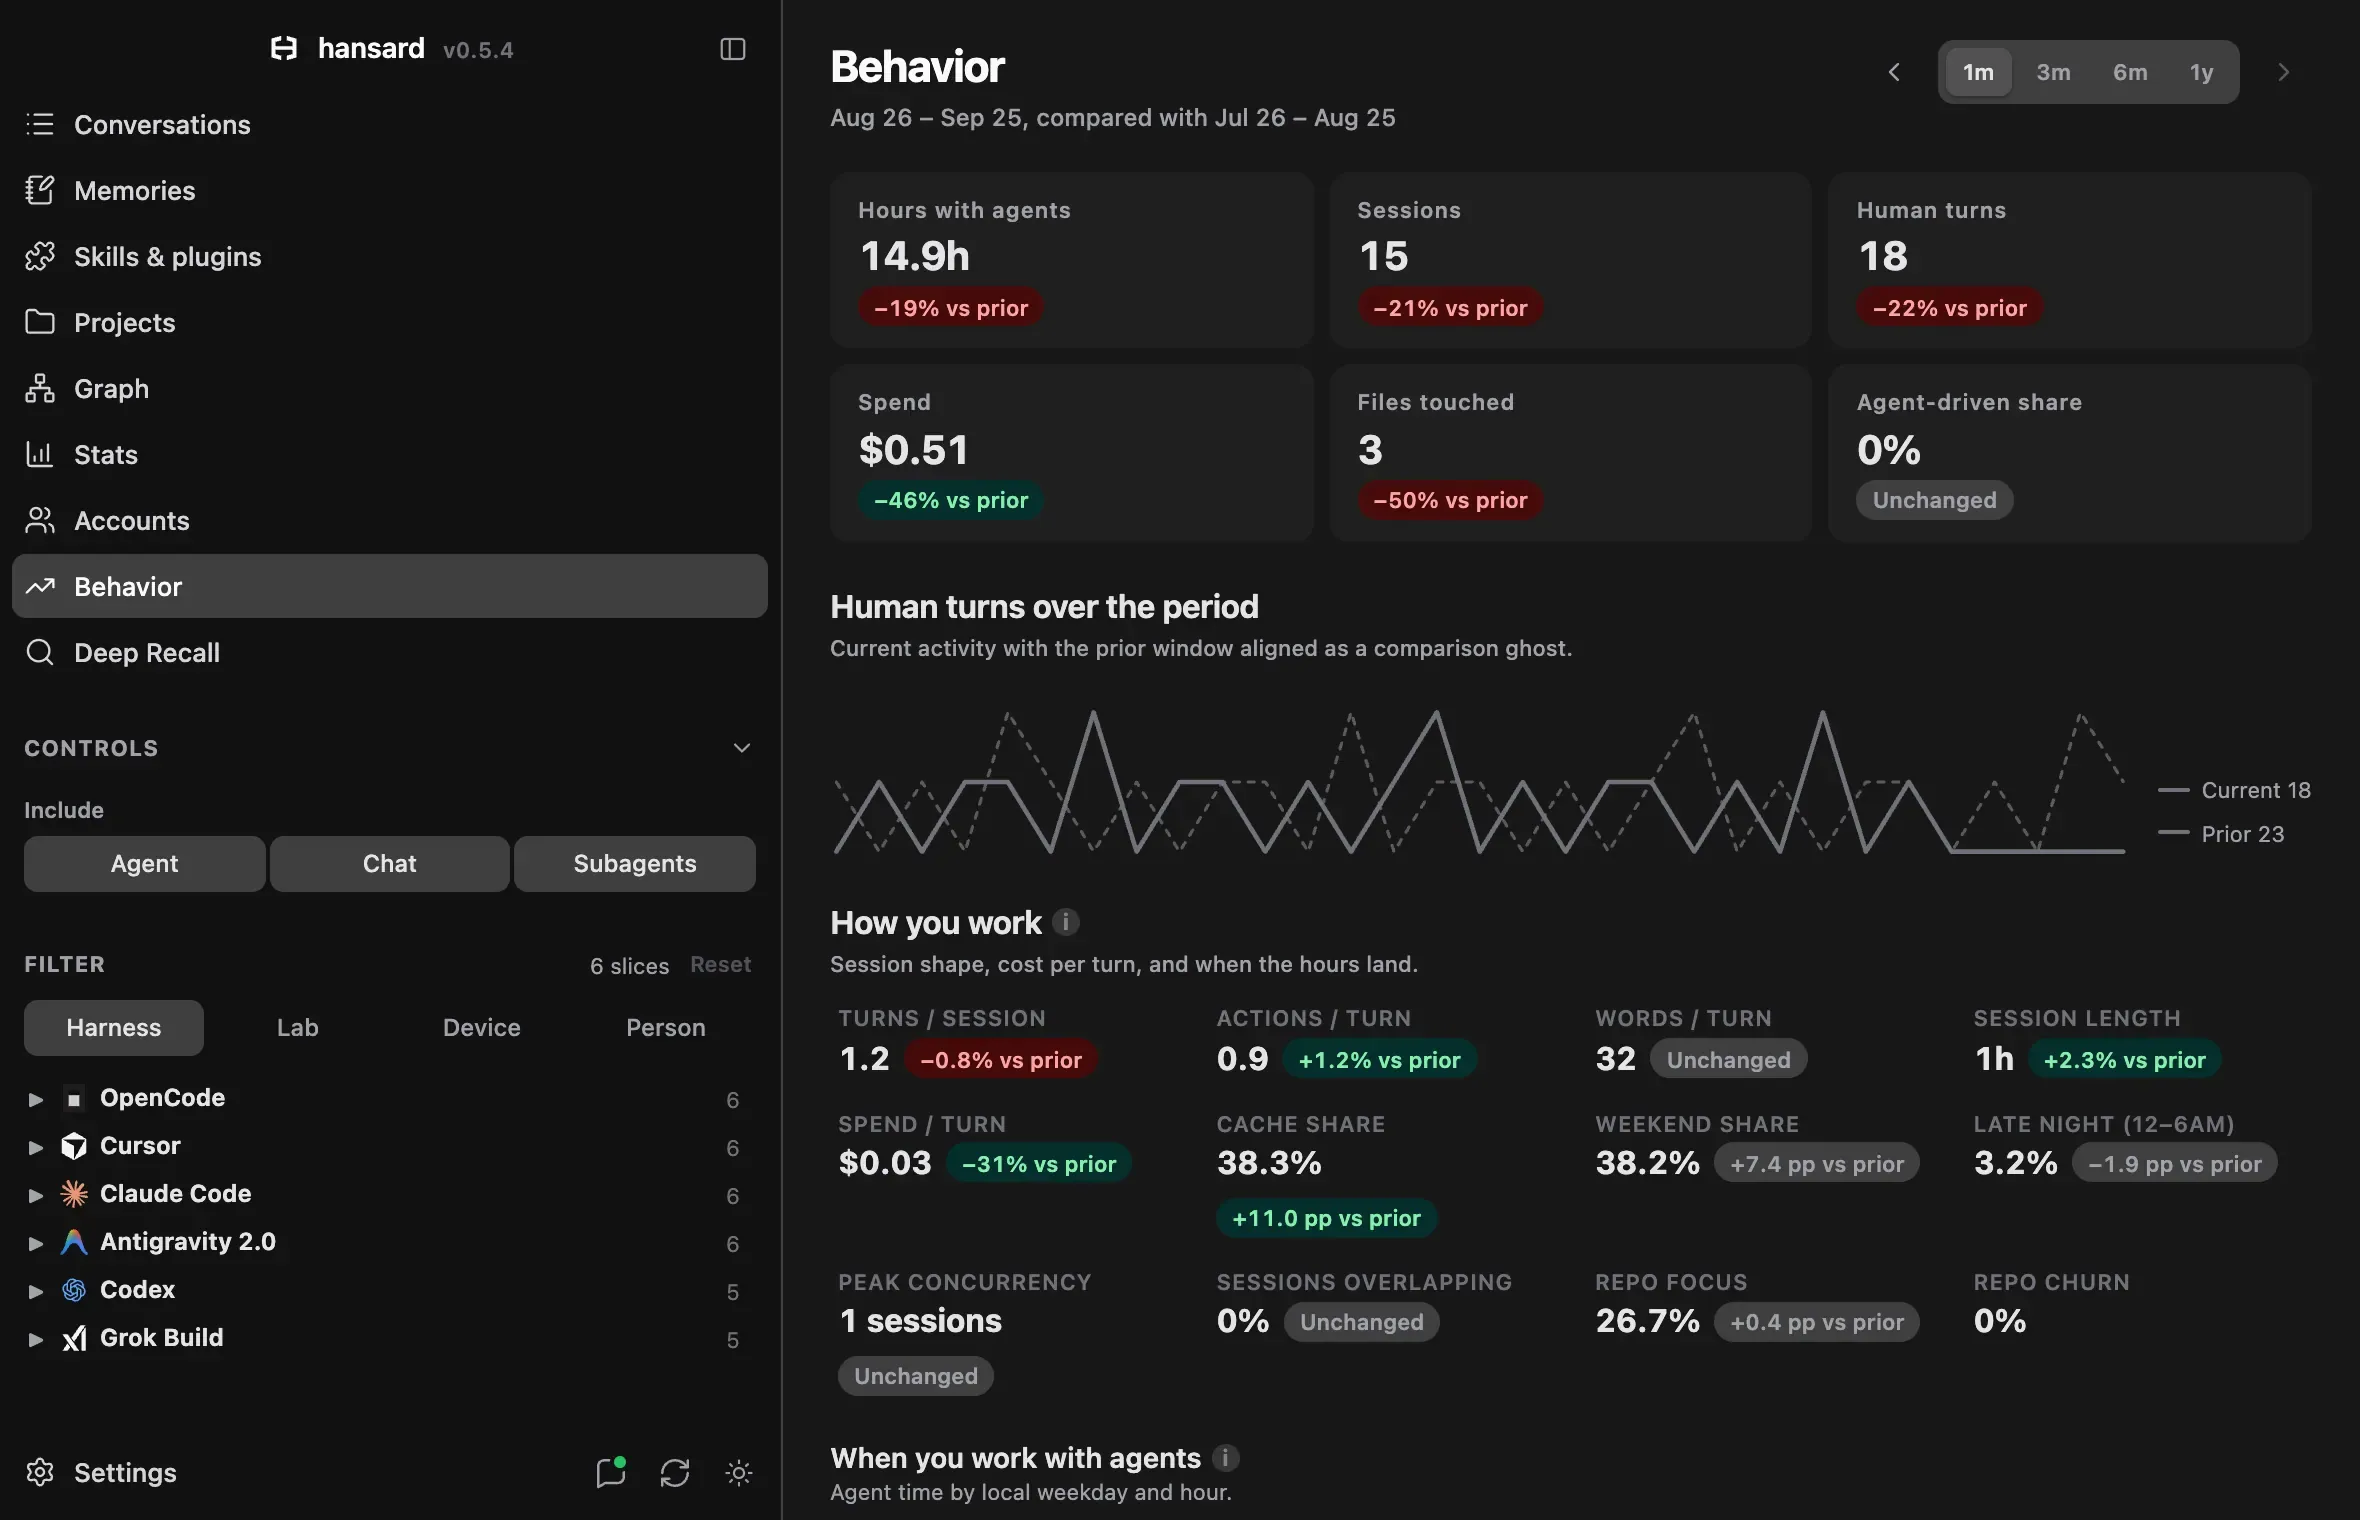
- Select Stats in the dock, then the Changes tab.
- Under Time range in the sidebar, choose 1M, 3M, 6M, 1Y, or Custom. The current period is that range, cut at today, and the prior period is the same number of days right before it. The section subtitle names both. All has no earlier period, so the tab asks for a specific date range.
- Optional: use Include and Filter to limit which sessions count. They apply to both periods. Show by sets the grouping in Which providers gained ground?, and Activity metric switches the running total, the mix, and the hour chart between human turns and conversations.
- Hover any row, dot, or day for both periods’ exact values, and select the i button beside a title to see how it is measured.
SDK batch jobs and machine probes never count in either period. When the prior period holds less than a tenth of this period’s activity, the subtitle says so, because its shares then rest on a few sessions.
The Projects drill-in shares the Stats tabs but compares no periods, so it leaves Changes out.
What the Changes tab shows
Section titled “What the Changes tab shows”| Chart | What it compares |
|---|---|
| Did you do more or less? | Human turns, conversations, active days, session time, tokens, estimated spend, tool calls, and files touched, each with the prior value, this period’s value, and the change. |
| Are you ahead of the last period? | The running total of human turns by day, both periods drawn from their first day, and the day this period passed the prior period’s total. |
| Which providers gained ground? | Each group’s share of human turns in both periods, grouped by Show by. Groups under 1% of both periods open beneath the chart. |
| Did your hours shift? | The share of human turns in each local hour, this period against the prior one, and which part of the day moved most. |
| Which tools did you lean on more? | Each tool’s share of tool calls in both periods. Switch to Commands or Skills for shell commands or skills. Rows under 2% of calls open beneath the chart. |
| What’s new, and what went quiet? | Providers, models, projects, and skills used in only one of the two periods. |
| Did the way you work change? | Turns per conversation, session length, tool calls per turn, words per turn, agent-driven share, spend per turn, cache share, subagent share, weekend share, late-night share, peak concurrency, sessions overlapping, projects active, and the busiest project’s share. |
| Kinds of work and outcomes | Work-mode shares and outcome rates in both periods. Appears when classified sessions exist. |
Changes read as multiples (3×), percentages (+18%), or percentage points (+2.7 pts) for shares, since a relative change of a share misleads. A total the prior period did not have reads New; an average with no prior samples shows no change.
The rates use these definitions:
- A turn is a prompt a person typed. Sessions started by an SDK or a parent agent add no turns.
- Tool calls per turn and Words per turn are geometric means over agent conversations, so a few very long sessions do not dominate them.
- Agent-driven share is the share of conversations with more than 16 tool calls per prompt.
- Cache share is the share of input tokens that models read from their prompt cache instead of processing fresh. Sessions with estimated usage or no reported cache tokens are left out.
- Weekend share and Late night, 12 to 6 AM use agent time spread over the local hours each session spanned, capped per session.
- Busiest project’s share is the share of sessions in the period’s most active project.
Did your hours shift? places each prompt at the local hour it was sent.
Conversations archived before prompt times were recorded place their messages
by the conversation’s time, and the chart subtitle says how many; hansard rebuild --since all records the rest without a reimport.
Compare periods from the CLI
Section titled “Compare periods from the CLI”hansard behavior prints the same comparison in the terminal: the two
windows, the headline changes, the rates, the largest movers by model, harness,
repository, tool, command, and skill, and, when classification results exist,
the work-mode shift and goal-bearing outcomes.
hansard behaviorhansard behavior --period 3mhansard behavior --start 2026-07-01 --end 2026-09-30hansard behavior --period 1y --end 2026-06-30 --json| Option | Effect |
|---|---|
--period 1m|3m|6m|1y |
Sets the length of each window. The default is 1m. |
--start YYYY-MM-DD |
Sets the first day of the current window directly, as the Stats time range does. It overrides --period. |
--end YYYY-MM-DD |
Sets the last day of the current window, in local time. The default is today. |
--json |
Prints the full comparison data, including daily rows, hourly matrices for both periods, concurrency, repository focus, classification details, and any cached retrospective. |
Compare work modes and outcomes
Section titled “Compare work modes and outcomes”When Work classification is on, Kinds of work and outcomes compares the two periods:
- Which kinds of work grew? shows the share of sessions in each work mode, such as Build, Fix, or Understand, in both periods.
- Did more work succeed? compares judged success, at-least-partial and verified success, the no-clear-goal share, and classification coverage. Success rates leave out sessions with no clear goal.
The section subtitle shows how many sessions in each period are classified. If coverage is low, classify more conversations before you rely on the comparison.
Write a retrospective
Section titled “Write a retrospective”The Changes tab can ask your classification model to write a short retrospective of the current period. It never sends anything on its own.
- In Kinds of work and outcomes, select Write a retrospective.
- If classification uses a model outside your machine, select the checkbox that confirms the digest will be sent to that provider.
- Read the retrospective above the button.
The digest contains the period’s aggregate numbers, the names of your most active repositories, work-mode and outcome counts, and redacted excerpts from up to 24 of the most recent sessions. Hansard caches the result for that exact period and classification input. While the cache is valid, the button reads Use cached retrospective and makes no new request. The retrospective requires classification to be enabled in Settings → Classification.
Post a period comparison to Slack
Section titled “Post a period comparison to Slack”To share a period comparison with your team, post it to the Slack digest channel from the CLI. There is no app control for this.
hansard notify slack digest behavior --period 1m --dry-runhansard notify slack digest behavior --period 1m--dry-run prints the message without posting it. The post includes session,
turn, and hour totals with their changes, files touched, spend, repository
focus, peak concurrency, your top repository names, work-mode and outcome
counts, and the cached retrospective if you wrote one. It is sent only when you
run the command. See Slack to set up the connection and
digest channel.